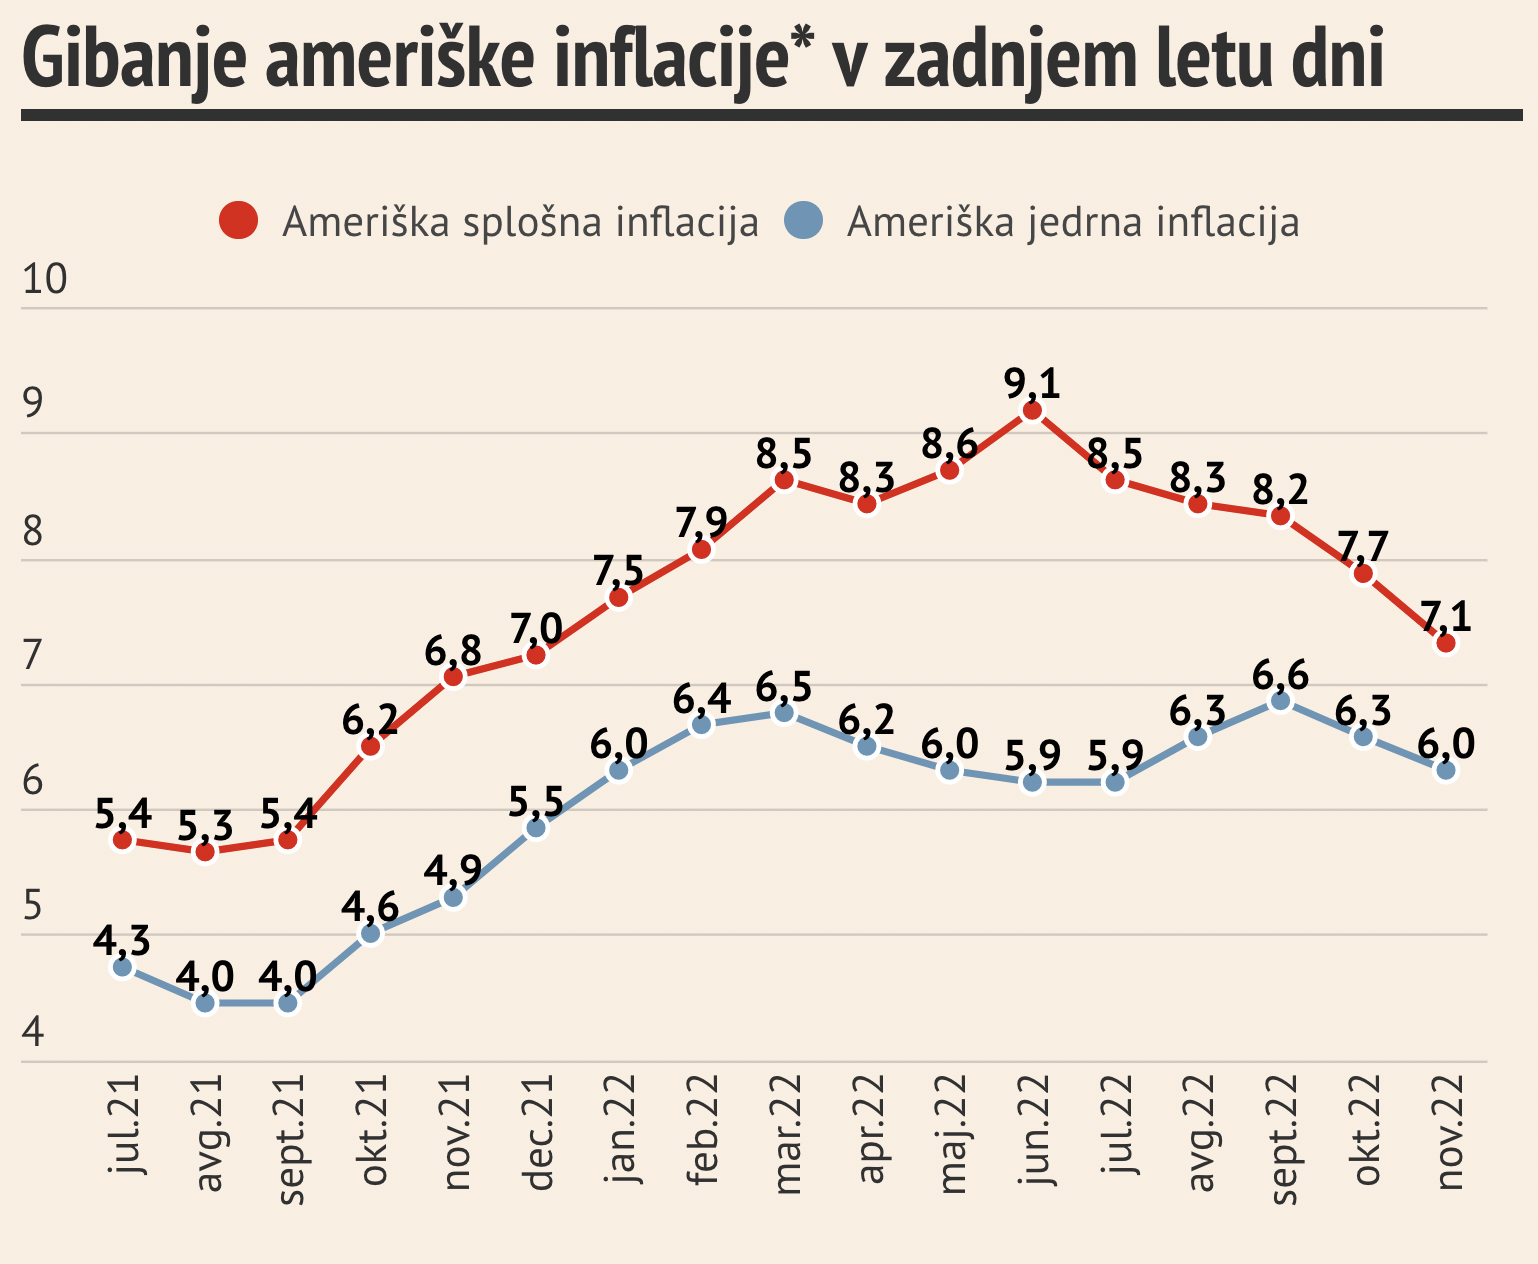
Za vse, ki želite razumeti, kje smo (kje so ZDA) na področju inflacije in ali lahko upamo na skorajšnji zaton zadnjega inflacijskega šoka, je Paul Krugman naredil izvrstno poljudno razlago. Zelo dobro je razložil 6 različnih mer temeljne inflacije in kaj te pomenijo glede dinamike tega inflacijskega šoka. Boljše poljudne razlage ne boste našli nikjer.
Tuesday’s inflation report from the Bureau of Labor Statistics was incredibly good — that is, it was too good to be credible. On their face, the numbers seemed to show that inflation has stopped dead in its tracks, or more accurately that it is back down to more or less the Federal Reserve’s long-run target of 2 percent. However, few analysts believe that the fight against inflation has already been won; hey, even I don’t believe that.
But how do we come to that conclusion? How do we extract the signal from the noise? Part of the answer is to smooth out the data by looking at changes over several months. Much reporting in the media focuses on changes over the past year, but that seems like too long a window in a rapidly changing economy. Like many other economists, I’ve been focusing mainly on three-month changes.
Even that, however, isn’t enough to correct for wild price swings that clearly shouldn’t be driving economic policy. Back in 1975, Robert Gordon of Northwestern University suggested focusing on inflation excluding volatile food and energy prices; this so-called core measure has become a standard way to assess “underlying” inflation. Since then, other measures have also been proposed, and until recently, they all tended to tell more or less similar stories.

You must be logged in to post a comment.