Mapping China’s New Export Dominance, Industrial Catch-Up and the Challenge for Europe
The emergence of what has come to be called “China Shock 2.0” (CS2) has triggered an increasingly intense debate among economists and policymakers, particularly in Europe, over the scale and nature of the new competitive challenge from China. Unlike the first China shock, which was associated primarily with China’s integration into world trade as a large exporter of labour-intensive manufactures, the current debate concerns China’s rapid expansion into technologically more sophisticated industries that overlap increasingly with Europe’s traditional areas of industrial specialisation. The central questions are therefore no longer simply whether Chinese exports are growing, but how large the new shock actually is, which industries it encompasses, whether it represents a broad-based challenge to European manufacturing or a much more concentrated sectoral phenomenon, and ultimately whether Chinese competition threatens to accelerate European deindustrialisation. These distinctions are important because much of the European policy debate implicitly treats China Shock 2.0 as a generalised external shock to European industry, whereas the underlying trade data may point to a considerably more differentiated phenomenon. The purpose of the analysis that follows is therefore to quantify China Shock 2.0 systematically, identify precisely where it has occurred since 2020, distinguish sectors in which Chinese dominance is already established from those experiencing rapid catch-up or only emerging competitive pressure, and thereby assess how large the shock really is from the perspective of the global and European industrial economy.
This analysis assesses the scale, timing and sectoral locus of the post-2020 expansion in Chinese exports commonly described as “China Shock 2.0”. It uses a single product-level trade database and a common methodology to measure three margins: the value and composition of Chinese exports in nine strategic manufacturing groups; China’s world-market share in each group and in the combined basket; and the contribution of these exports to total world merchandise trade. It then compares China with other major industrial exporters – Germany, Italy, France, the United States, Japan and South Korea. The objective is to identify where Chinese export dominance is already established, where rapid catch-up is under way, and where the next phase of the shock may emerge.
1. Data, product coverage and consistency
In this analysis, the product group associated with the China Shock 2.0 (henceforth: CS2.0 basket) comprises nine product groups: solar photovoltaic and related photosensitive devices (HS 854140), static converters including inverters (HS 850440), lithium-ion batteries (HS 850760), plug-in hybrid and electric vehicles (HS 870360, 870370 and 870380), wind-powered generating sets (HS 850231), heat pumps (HS 841861), industrial robots (HS 847950), semiconductors (HS 8542), and semiconductor manufacturing equipment (HS 848620). The vehicle group combines plug-in hybrid passenger vehicles with fully electric passenger vehicles and excludes conventional non-plug-in hybrids.
All indicators are constructed consistently at product level for 2017–2024 using the CEPII (2026), BACI International Trade Database (Version 202601), which rests on UN Comtrade database. For each product group, Chinese exports are divided by world exports of the same group to obtain the product-specific market share. The aggregate CS2.0 share divides Chinese exports of all nine groups by world exports of the same nine groups. A second denominator—total world merchandise exports—is used to gauge the basket’s importance in global trade. Product contributions sum exactly to the relevant aggregate, ensuring accounting consistency across tables and figures.
2. The scale and composition of China’s CS2 export expansion
Table 1 reports the principal aggregate indicators. Chinese exports in the nine-group basket increased from USD 113.8 billion in 2017 to USD 186.6 billion in 2020 and USD 347.9 billion in 2024. The post-2020 increase was therefore USD 161.3 billion, or 86.5 per cent. China’s combined share of world exports in these markets rose from 17.4 per cent in 2020 to 21.4 per cent in 2024, while the basket’s contribution to total world merchandise exports increased from 1.09 to 1.52 per cent.
Table 1: Scale and global significance of Chinese CS2.0 exports
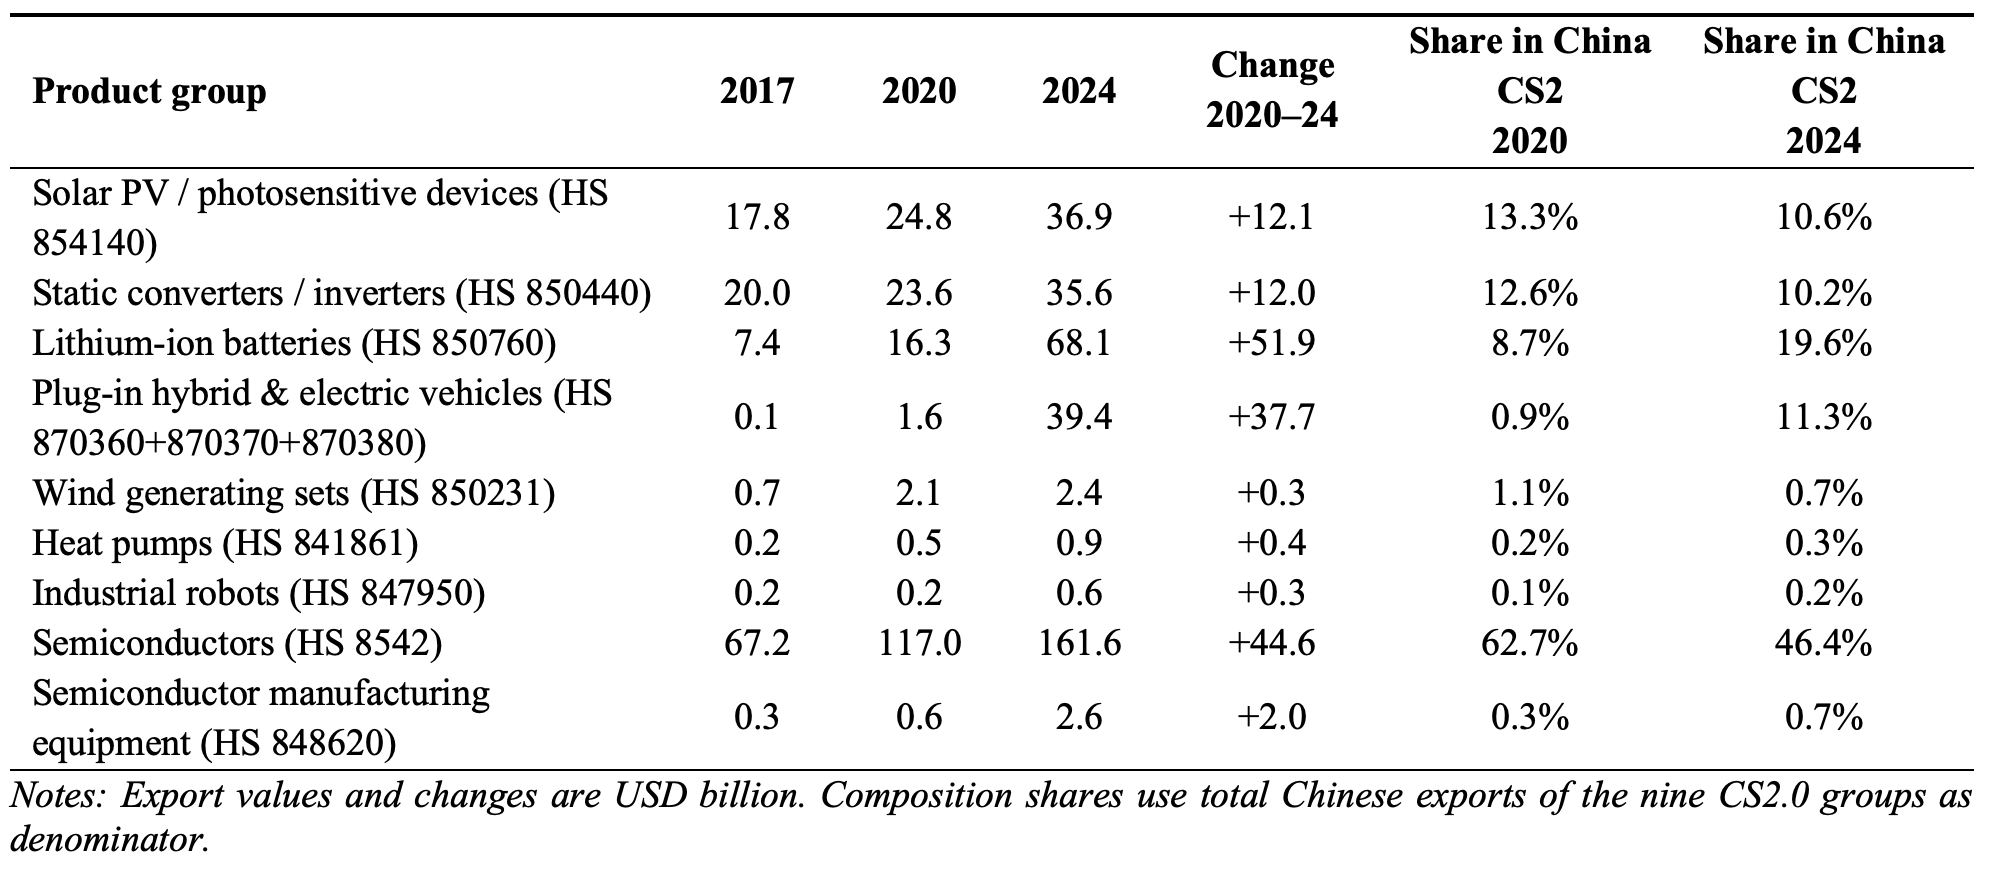
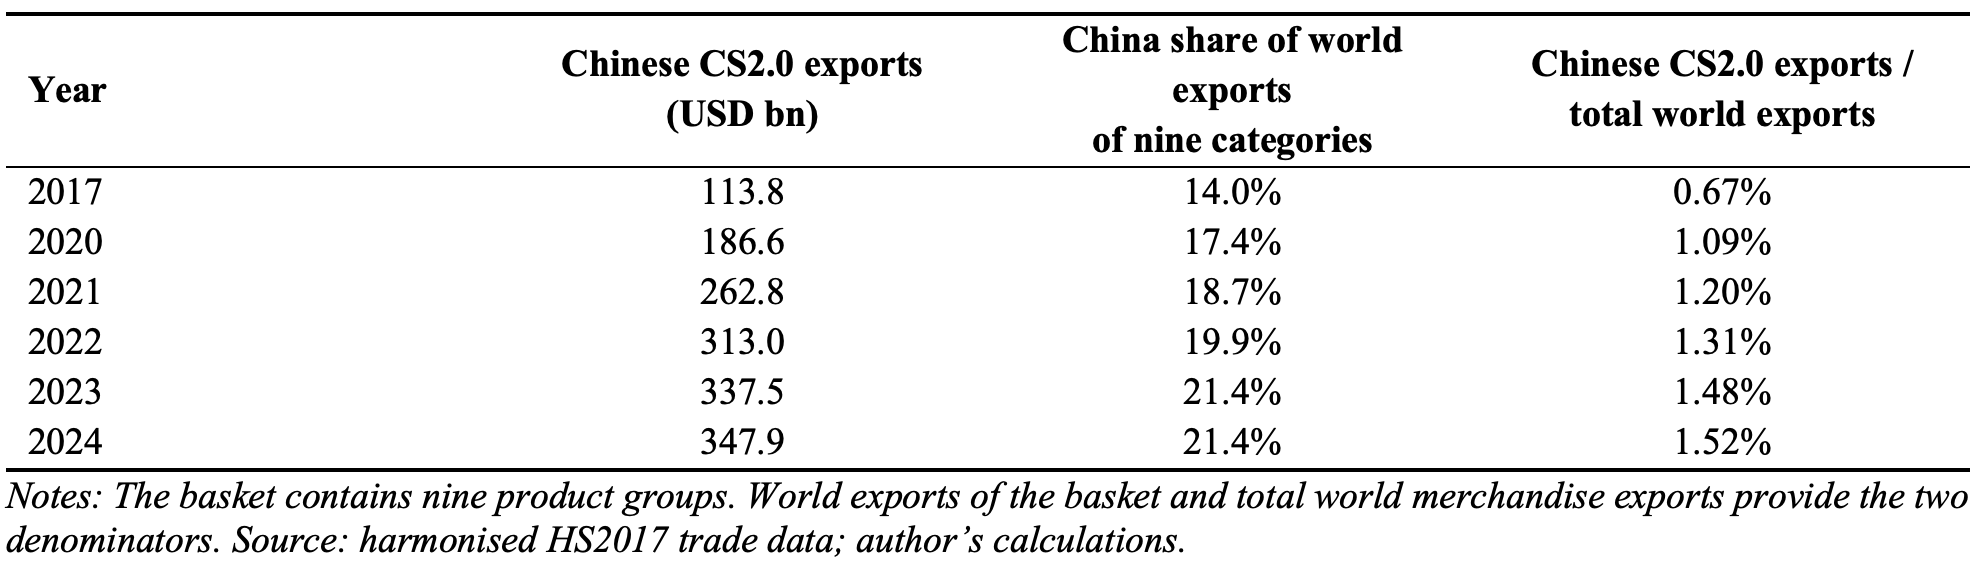 Table 2 locates the expansion within the basket. The largest absolute increases between 2020 and 2024 came from lithium-ion batteries (+USD 51.9 billion), semiconductors (+USD 44.6 billion) and plug-in hybrid and electric vehicles (+USD 37.7 billion). Batteries and EVs therefore account for most of the genuinely new post-2020 export acceleration, while semiconductors remain the largest single category in level terms but grow much less dramatically in market-share terms.
Table 2: Product-level restructuring of Chinese CS2.0 exports
3. Product-specific world-market shares
The post-2020 rise is highly heterogeneous across products. The most dramatic gain occurred in lithium-ion batteries, where China’s share of world exports rose from 39.8 per cent in 2020 to 58.9 per cent in 2024 (+19.1 percentage points). In plug-in hybrid and electric vehicles, the share jumped from only 2.7 to 19.1 per cent (+16.4 points), while wind generating sets increased from 22.7 to 34.2 per cent (+11.5 points). Heat pumps rose from 16.2 to 21.5 per cent (+5.3 points), industrial robots from about 4.5 to 9.6 per cent (+5.1 points), and solar PV from 43.0 to 47.3 per cent (+4.3 points). Semiconductor manufacturing equipment increased from about 1.2 to 3.9 per cent, but remains a frontier catch-up sector. By contrast, semiconductors moved only from 14.9 to 15.4 per cent and converters slipped slightly from 37.8 to 37.3 per cent.
Figure 1: China’s share of world exports by CS2.0 product group, 2017–2024
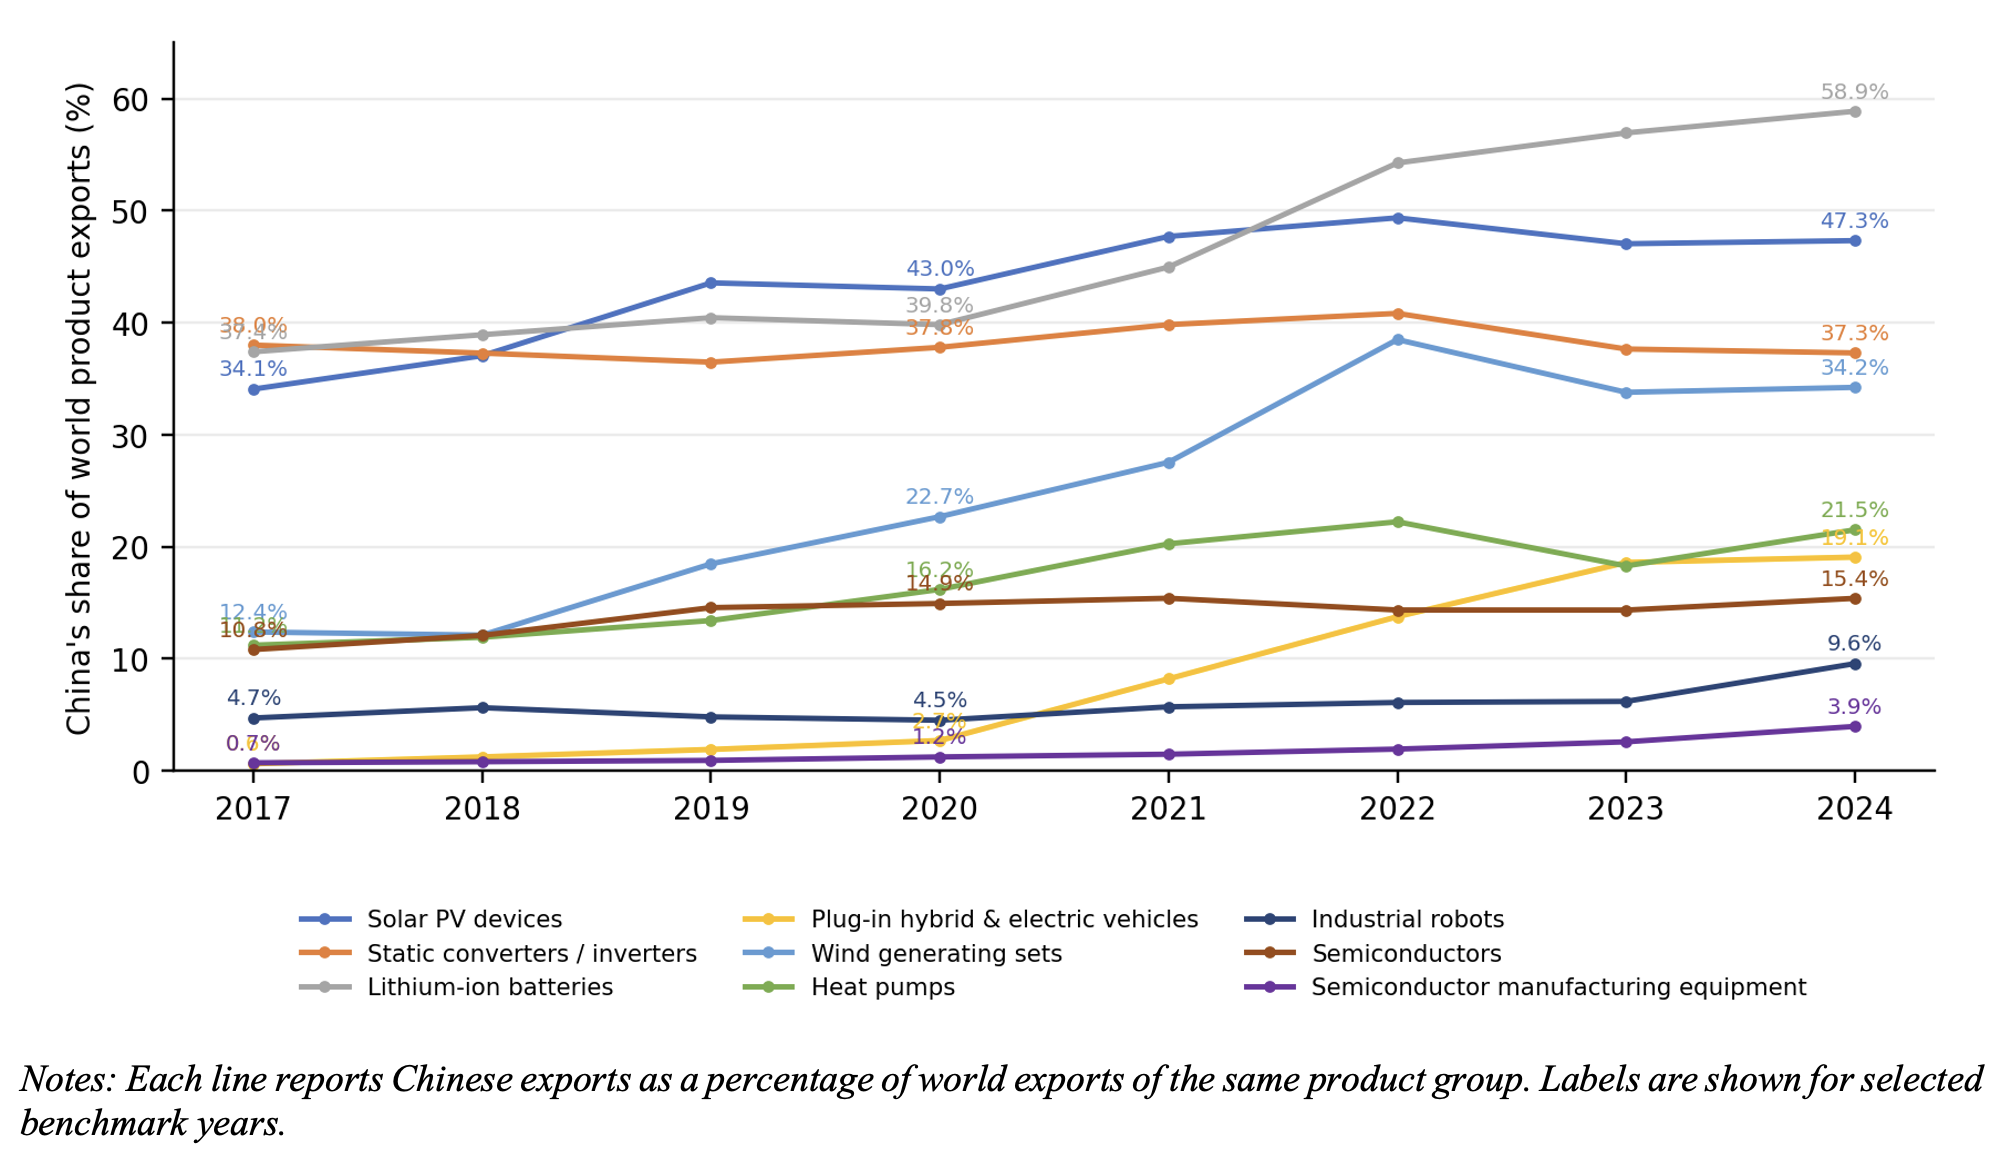 Notes: Each line reports Chinese exports as a percentage of world exports of the same product group. Labels are shown for selected benchmark years.
4. Decomposing the aggregate shock
The aggregate nine-group market share increased from 17.4 per cent in 2020 to 21.4 per cent in 2024. At the product level, the strongest increases in China’s penetration of the relevant world markets were batteries, EVs, wind equipment, heat pumps and industrial robots. When the denominator is instead total world merchandise exports, the largest increases were again concentrated in batteries and EVs: Chinese battery exports rose from 0.095 per cent of total world merchandise exports in 2020 to 0.298 per cent in 2024, and EV/PHEV exports from 0.010 to 0.172 per cent. Semiconductors rose only from 0.682 to 0.707 per cent, solar from 0.145 to 0.161 per cent, converters from 0.137 to 0.156 per cent, and semiconductor equipment from 0.003 to 0.011 per cent. Thus most of the incremental global-trade footprint of CS2.0 after 2020 came from batteries and vehicles rather than from semiconductors.
The importance of semiconductors in the level of the basket mechanically dampens the measured aggregate market-share increase because semiconductors are a very large global market in which China’s share changed little. Excluding semiconductors while retaining the other eight groups, China’s share of world exports in the CS2.0 basket would have risen from 24.1 per cent in 2020 to 32.3 per cent in 2024—an increase of 8.1 percentage points rather than about 4.0 points for the full nine-group basket. The same eight-group basket would have risen from 0.41 to 0.82 per cent of total world merchandise exports, essentially doubling. This counterfactual makes clear that the post-2020 shock is considerably stronger in the non-semiconductor part of the basket.
Figure 2: Decomposition of China’s aggregate share of world CS2.0 exports, 2017–2024
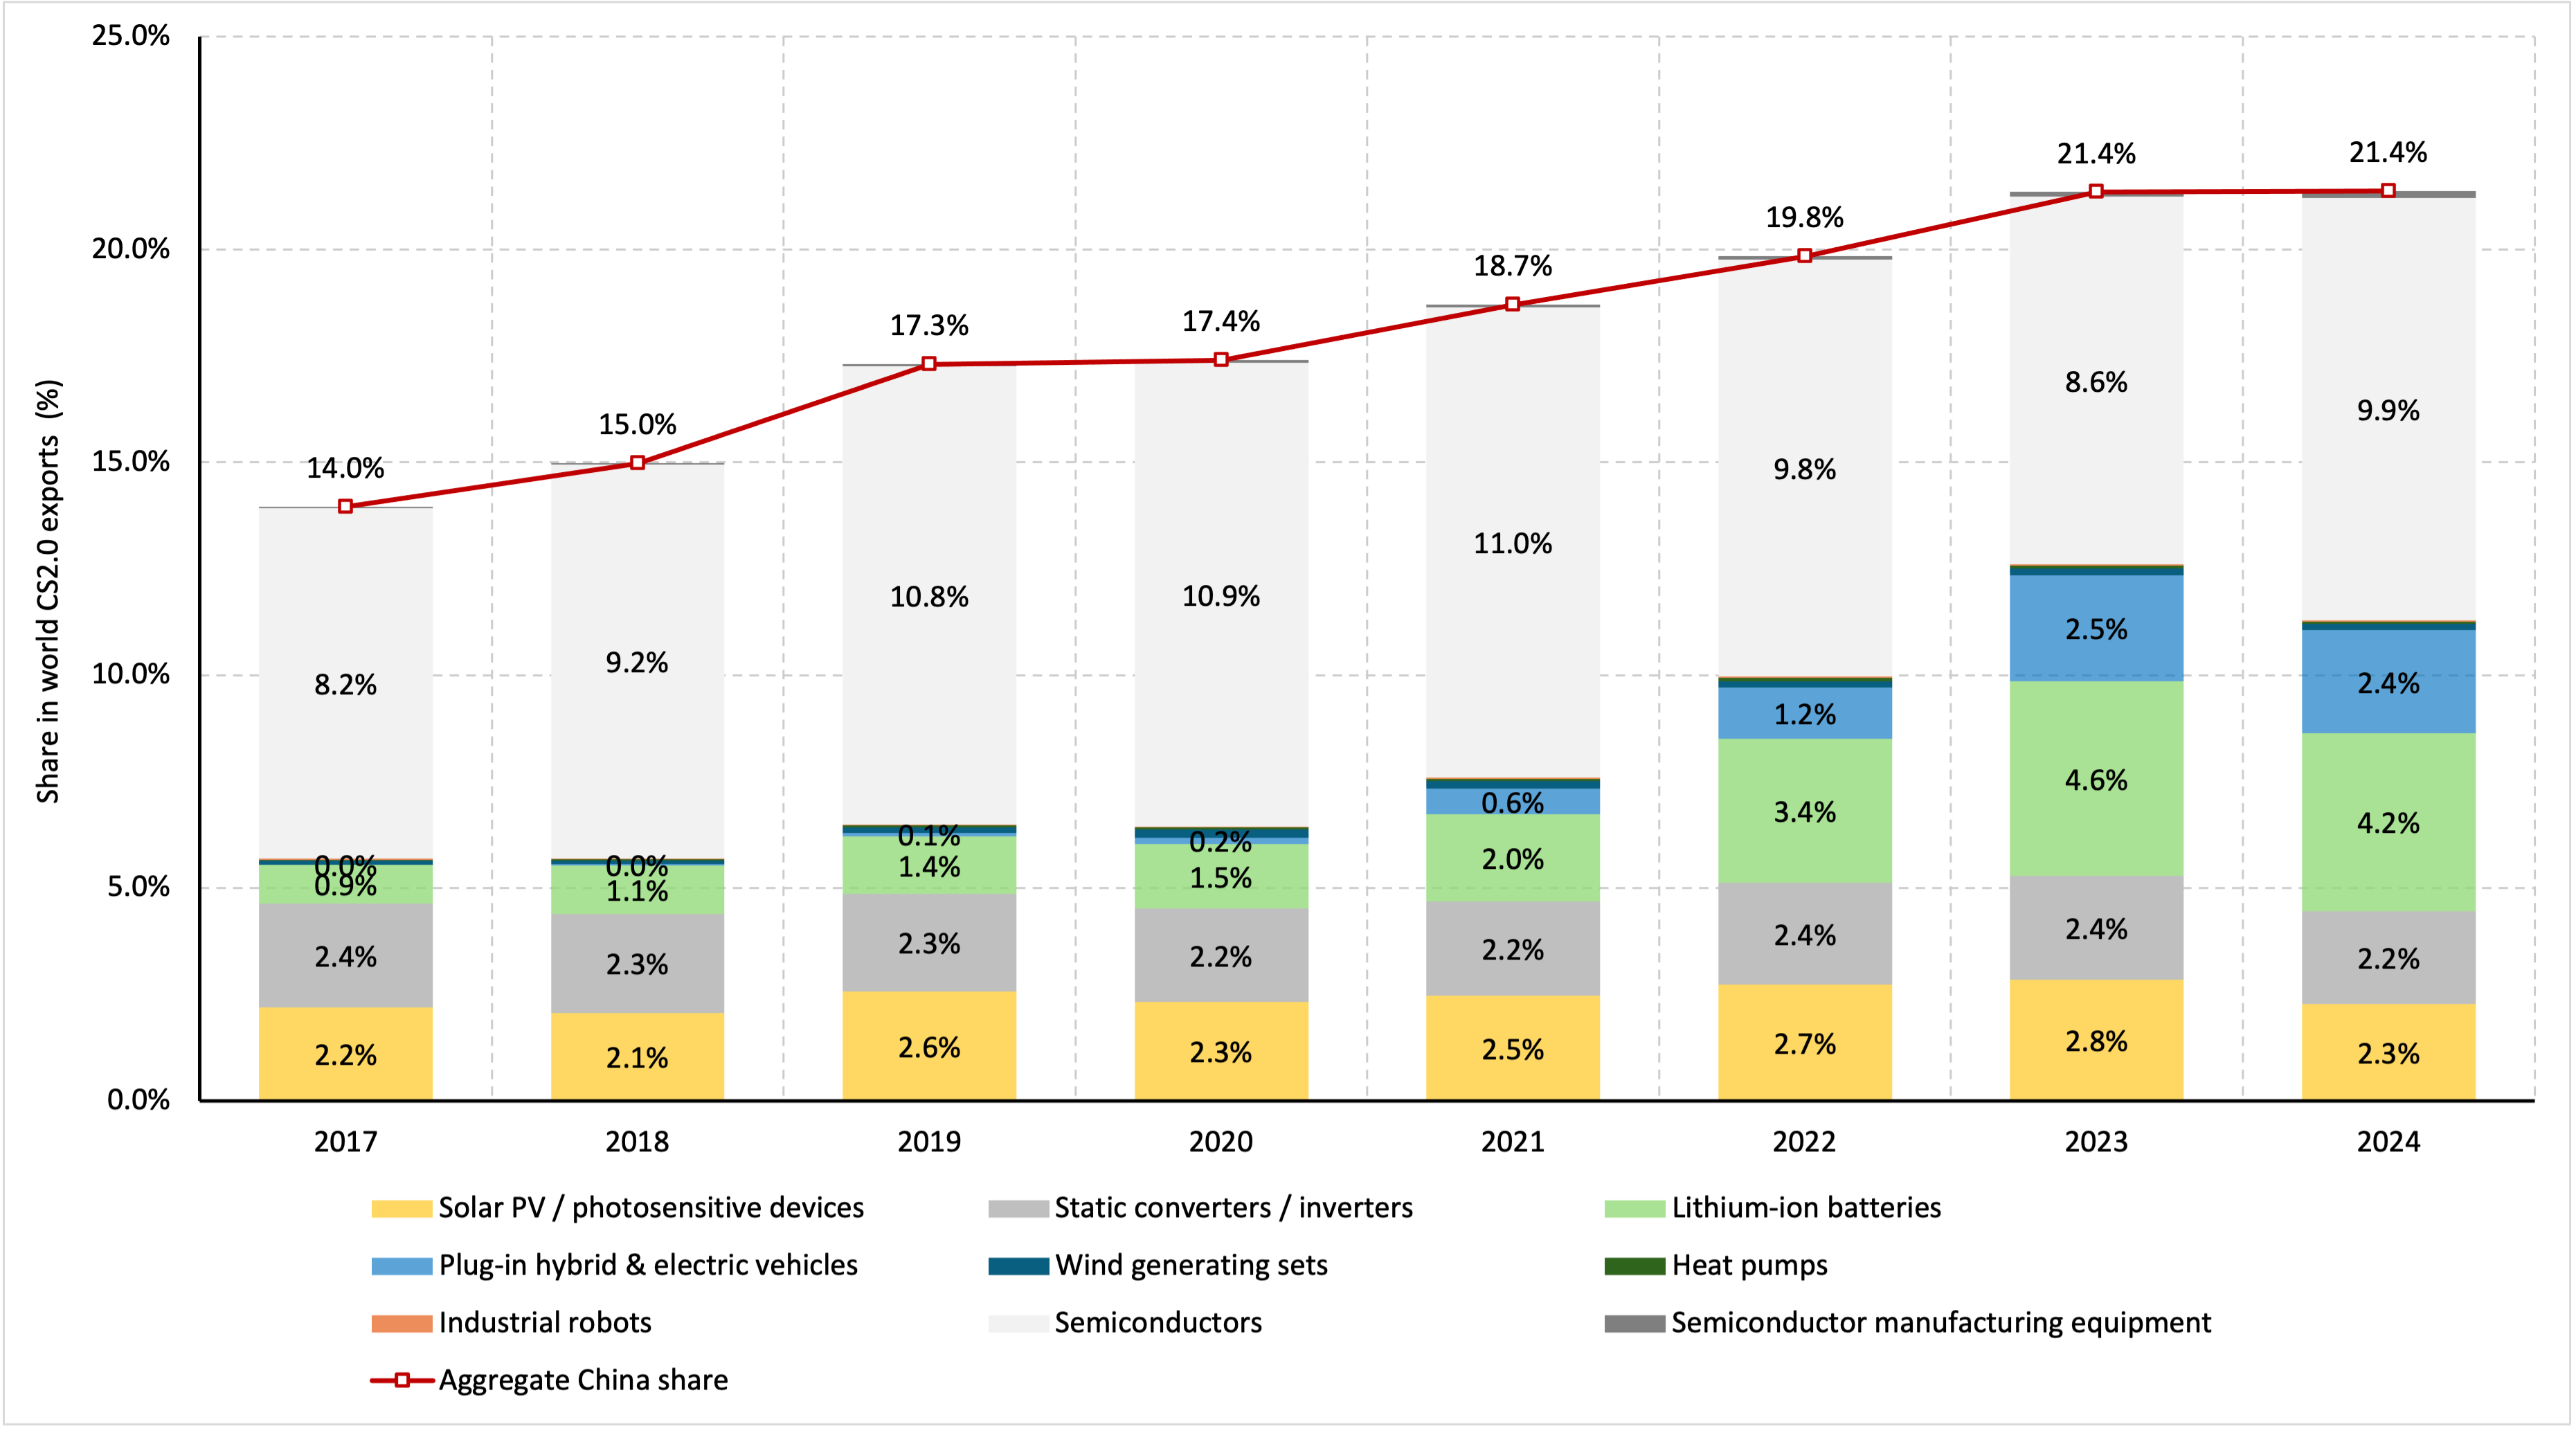 Notes: The total bar equals Chinese exports of the nine CS2.0 groups divided by aggregate world exports of those groups. Each segment is a percentage-point contribution.
Figure 3: Decomposition of China’s CS2.0 exports as a share of total world merchandise exports, 2017–2024
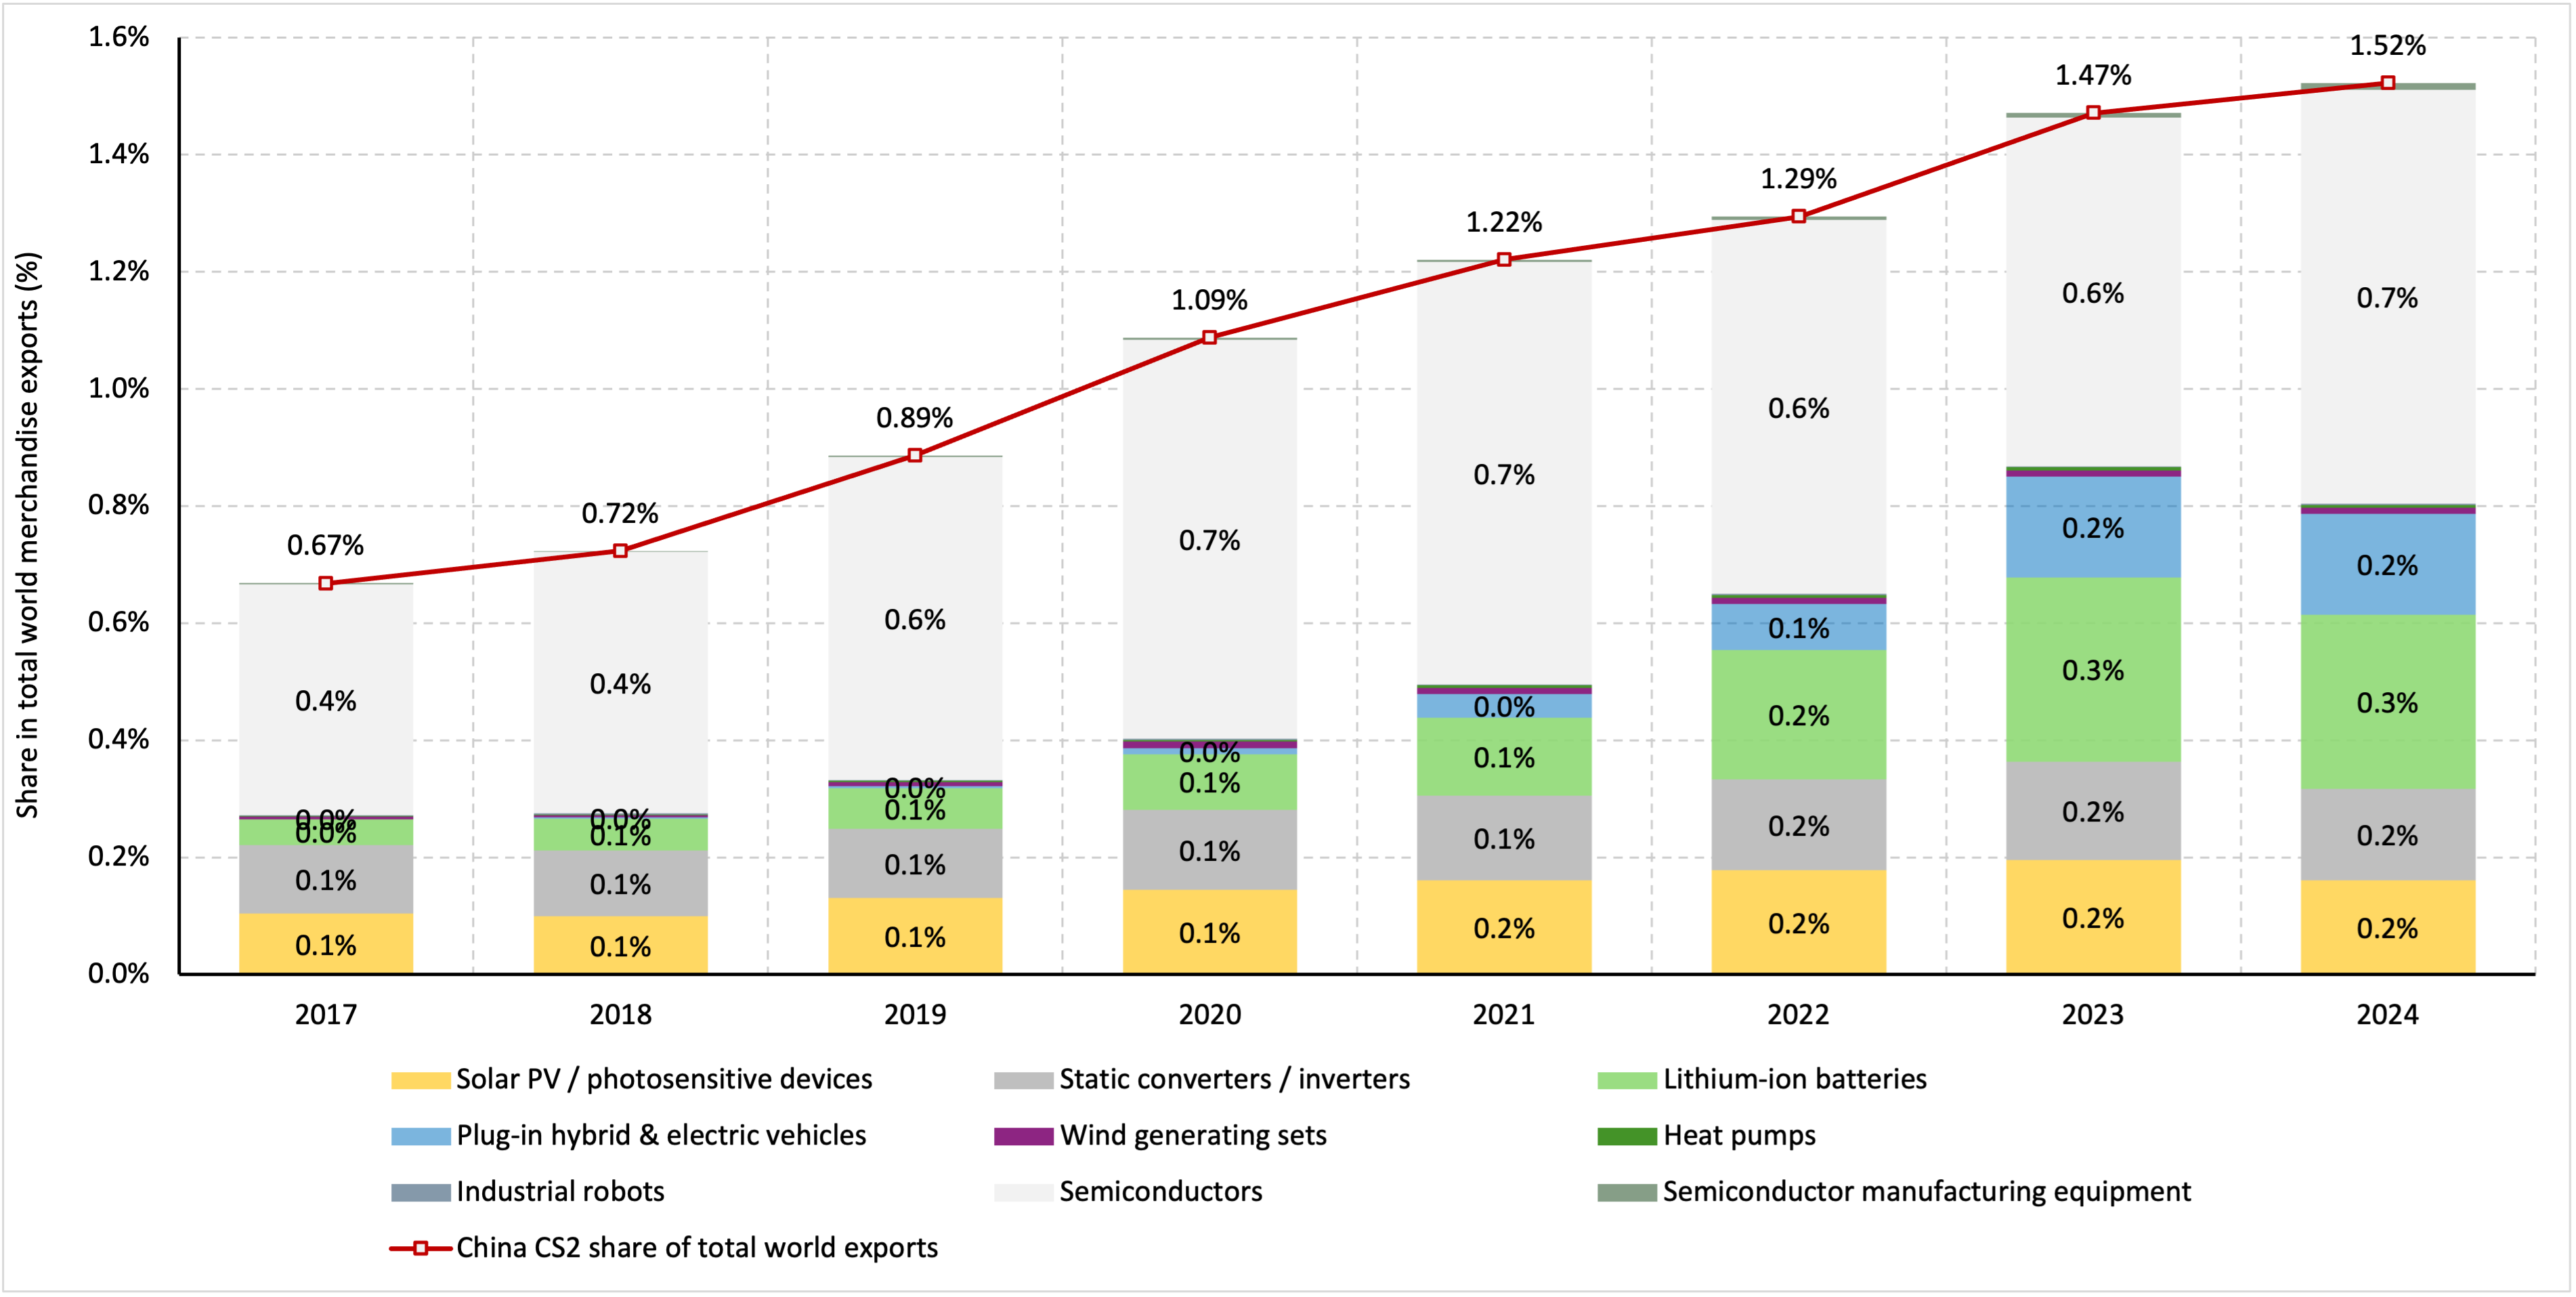 Notes: The total bar equals Chinese exports of the nine groups divided by total world merchandise exports.
5. Three segments of China Shock 2.0
The unified basket can be interpreted as three competitive segments. The first captures established or widening dominance in electrification and renewable-energy equipment. The second captures rapid catch-up in markets where China is moving from a low initial export share toward the technological frontier. The third captures strategic frontier and upstream catch-up in semiconductors and the equipment used to manufacture them. Table 3 shows that the first two segments generated almost the entire post-2020 increase in China’s global CS2.0 footprint, whereas the semiconductor segment remains large in value but shows only a modest increase in world-market penetration.
Table 3: Three segments of China Shock 2.0, 2020–2024
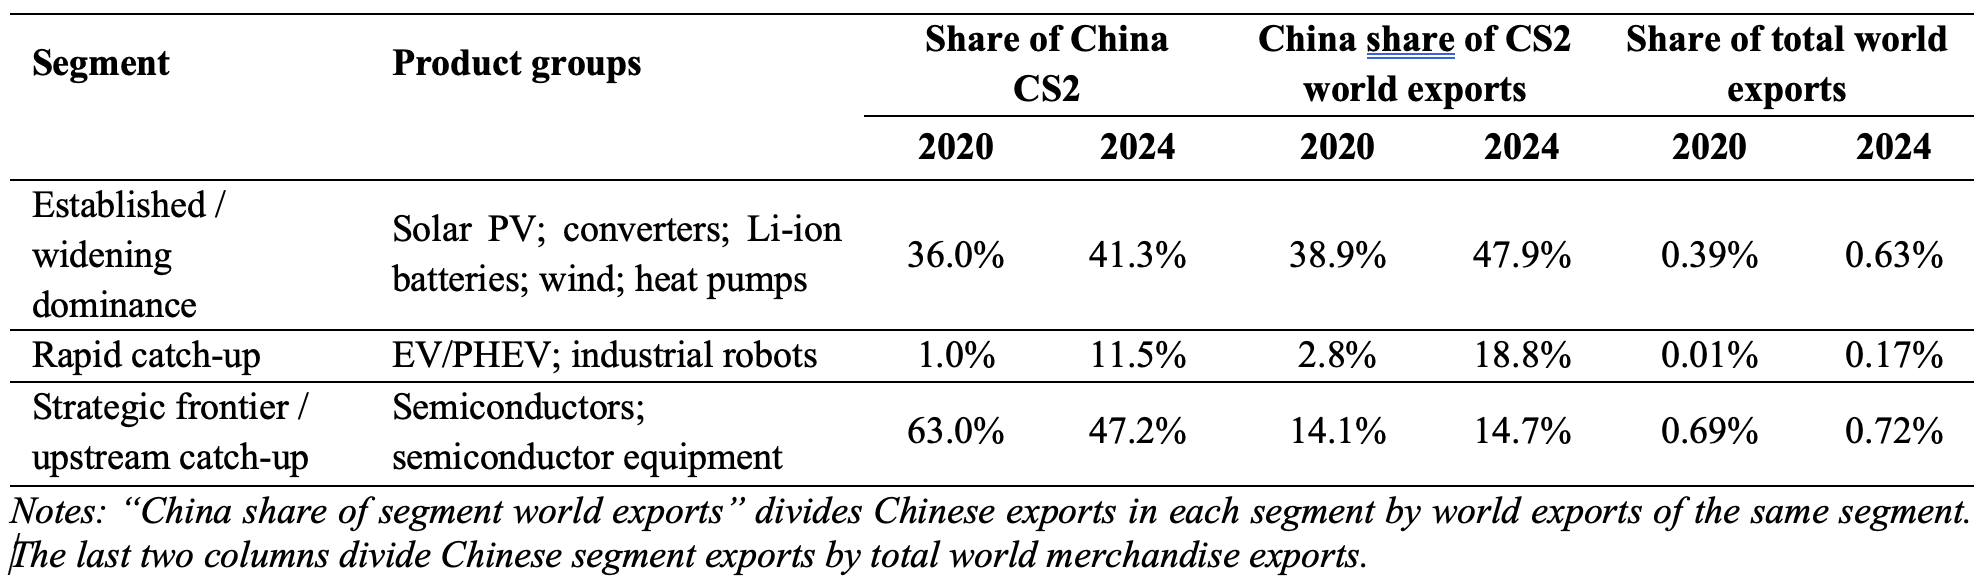 The established/widening-dominance segment increased from 36.0 to 41.3 per cent of China’s own CS2.0 basket and its share of the corresponding global markets rose from 38.9 to 47.9 per cent. Its contribution to total world merchandise exports increased from 0.39 to 0.63 per cent. The rapid-catch-up segment is the clearest manifestation of a new shock: it rose from only 1.0 to 11.5 per cent of China’s basket, its world-market share surged from 2.8 to 18.8 per cent, and its contribution to total world exports rose from 0.01 to 0.17 per cent. By contrast, the strategic-frontier segment fell from 63.0 to 47.2 per cent of China’s basket because other groups expanded faster; its world-market share moved only from 14.1 to 14.7 per cent and its contribution to world trade from 0.69 to 0.72 per cent. This is therefore less the locus of the realised post-2020 shock than the most plausible locus of a future one if Chinese semiconductor and equipment localisation continues.
6. China relative to major industrial exporters
The cross-country comparison reveals that China Shock 2.0 is not simply a story of rising Chinese exports, but of a rapid reordering of competitive positions among the world’s major industrial economies. Comparing China with Germany, Italy, France, the United States, Japan and South Korea shows three quite different patterns. In the first group of industries, China had already established a commanding position by 2020 and subsequently widened or consolidated its lead. In the second, it started from well behind the traditional industrial leaders but made exceptionally rapid gains after 2020. In the third, consisting mainly of technologically more demanding upstream industries, China is still catching up with established Japanese, Korean and American producers. This distinction is important because it shows that China Shock 2.0 is neither a uniform Chinese takeover of advanced manufacturing nor merely the continuation of an already established dominance in green technologies.
The clearest case of established and widening dominance is lithium-ion batteries. China already accounted for 39.8 per cent of world exports in 2020, far ahead of South Korea at 12.1 per cent, Germany at 7.9 per cent and Japan at 5.7 per cent. By 2024, China’s share had risen spectacularly to 58.9 per cent, while the shares of South Korea, Germany and Japan had fallen to only 4.4, 4.2 and 3.2 per cent, respectively. Solar PV displays a similar, although more mature, pattern: China increased its world-market share from 43.0 to 47.3 per cent, while Japan fell from 8.7 to 5.5 per cent, South Korea from 5.5 to 2.3 per cent and Germany from 4.1 to 2.9 per cent. In static converters and inverters, China maintained a remarkably stable share of around 37 per cent, more than four times Germany’s 8.4 per cent in 2024. Heat pumps show a somewhat less extreme but similarly revealing shift. China increased its share from 16.2 to 21.5 per cent, while Germany declined from 14.1 to 12.3 per cent and France from 15.8 to 8.3 per cent. In these industries, therefore, China Shock 2.0 largely represents the consolidation or extension of an industrial position that had already become very strong by 2020.
Wind equipment and especially electric vehicles tell a different and more consequential story because here China overtook, or rapidly approached, established industrial leaders during the CS2.0 period itself. In wind generating sets, Germany was still the largest exporter among the seven economies in 2020, with 25.4 per cent of the world market compared with China’s 22.7 per cent. Four years later their positions had reversed: China’s share had risen to 34.2 per cent, while Germany remained at 25.5 per cent. The transformation in electric vehicles is much more dramatic. In 2020 China accounted for only 2.7 per cent of world PHEV and EV exports, compared with 24.3 per cent for Germany, 14.9 per cent for the United States, 7.9 per cent for South Korea and 5.2 per cent for Japan. China therefore ranked only sixth among the seven economies. By 2024 its share had increased more than sevenfold to 19.1 per cent, propelling it to second place. Germany remained the leader at 27.1 per cent, but the gap between the two economies narrowed from more than 21 percentage points to only 8 points. At the same time, the United States fell to 5.2 per cent, South Korea to 6.3 per cent, while Japan reached 7.0 per cent. This is arguably the clearest example of a genuine post-2020 China Shock 2.0: rather than merely defending an inherited dominant position, China entered a market led by advanced-economy producers and displaced most of them within only four years.
Table 4: China’s CS2.0 market-share position relative to six major industrial exporters
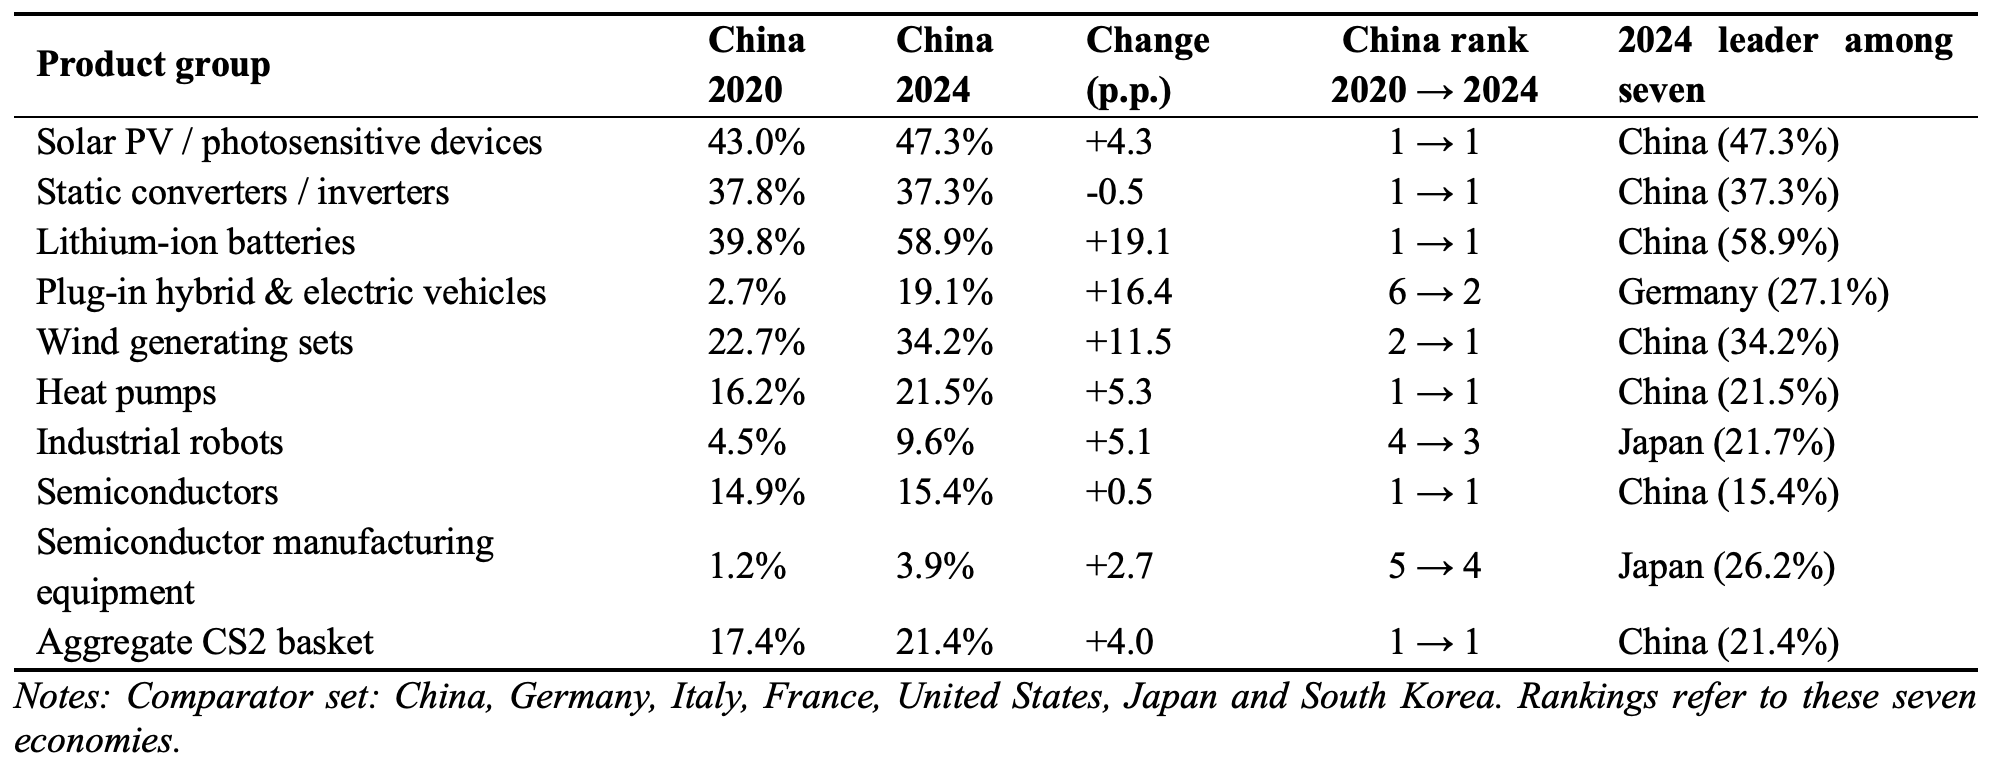 Industrial robots and the semiconductor complex represent the third pattern: China is advancing rapidly, but has not yet displaced the technological incumbents. In industrial robots, China doubled its world-market share from 4.5 per cent in 2020 to 9.6 per cent in 2024, moving from fourth to third place among the seven economies and almost catching Germany, whose share declined from 11.6 to 10.7 per cent. Japan nevertheless remained clearly dominant despite a substantial decline from 28.7 to 21.7 per cent. Semiconductor manufacturing equipment displays an even larger technological gap. China more than tripled its share from 1.2 to 3.9 per cent and moved from fifth to fourth place, but remained far behind Japan at 26.2 per cent and the United States at 16.2 per cent in 2024. Semiconductors themselves require a more nuanced interpretation. China already had the largest gross-export share among the seven economies in 2020, at 14.9 per cent, narrowly ahead of South Korea at 12.6 per cent, and increased it only modestly to 15.4 per cent by 2024. South Korea remained close at 11.5 per cent, while the United States and Japan accounted for 4.9 and 3.1 per cent. China’s position in semiconductor exports should therefore not be confused with technological dominance across the semiconductor value chain: the continuing Japanese and American lead in semiconductor manufacturing equipment illustrates precisely where important frontier dependencies remain.
7. Industrial-policy foundations: Made in China 2025 and the policy system behind CS2.0
The sector-specific nature of the export expansion documented above is also supported by Damijan et al. (2026), who show that the macroeconomic factors associated with China’s aggregate manufactured-export expansion since 2000 do not automatically explain China Shock 2.0. While aggregate Chinese export-share growth is significantly associated with exchange-rate competitiveness and investment-led capacity formation, neither REER movements nor estimated BEER misalignment significantly explain China’s post-2020 gains in the CS2.0 product basket. This suggests that China Shock 2.0 is a distinct and highly sector-specific phenomenon, more consistent with the cumulative effects of targeted industrial policies and the development of integrated strategic manufacturing ecosystems than with the conventional macroeconomic mechanisms behind China’s broader export expansion.
Seen in this light, the export expansion documented above should not be understood as the result of a single subsidy programme, but as the cumulative outcome of a much broader industrial-policy architecture. Its central strategic statement was Made in China 2025 (MIC2025), launched in 2015 to upgrade manufacturing, reduce dependence on foreign technology and move Chinese firms toward higher-value activities. The programme explicitly prioritised new-generation information technology, including semiconductors; high-end numerical-control machinery and robotics; energy-saving and new-energy vehicles; and power equipment. These priorities map directly onto a large part of the CS2.0 basket. Solar, wind, batteries, converters and heat pumps also benefited from the broader green-development, power-equipment and strategic-emerging-industry agenda that complemented MIC2025.
The policy mix was deliberately broader than direct grants. It combined central and local subsidies, preferential taxation, below-market credit from state-linked banks, government guidance funds and state equity, R&D programmes, national and provincial innovation centres, public procurement, local-content and technology standards, demand subsidies, infrastructure provision, preferential land and energy, and policies encouraging technology acquisition and localisation. In EVs, for example, supply-side support was reinforced by buyer rebates, purchase-tax exemptions, charging infrastructure and government procurement. In solar and wind, producer support was complemented by feed-in tariffs and deployment mandates that created a very large home market, accelerated learning-by-doing and supported scale economies. In semiconductors, state investment funds were explicitly designed to finance domestic fabrication, equipment and materials capabilities.
The scale is unusually large, although no single number captures the entire system. A conservative CSIS estimate puts Chinese industrial-policy spending in 2019 at about USD 248 billion, or 1.73 per cent of GDP; a broader specification including harder-to-measure instruments could be much larger. OECD evidence for 2005–2024 finds that China-based industrial firms received on average three to eight times more support than OECD-based competitors. The OECD also estimates that subsidies can explain almost 60 per cent of the global market-share gains of expanding Chinese manufacturing firms. Across the sectors in the present basket, solar PV and semiconductors stand out among the most heavily subsidised industries in the OECD MAGIC database; solar subsidies averaged nearly 3.2 per cent of firm revenue over 2005–2024.
Sector-specific estimates reinforce this picture. CSIS estimates cumulative Chinese government support to the new-energy-vehicle industry at about USD 230.9 billion between 2009 and 2023, including buyer rebates, tax exemptions, charging infrastructure, R&D and procurement. For semiconductors, public funding since the 2014–2015 launch of the localisation drive is estimated at roughly USD 150 billion; the third phase of the National Integrated Circuit Industry Investment Fund alone was capitalised at RMB 344 billion (about USD 47.5 billion) in 2024. Renewable-energy support has also operated through the demand side: the 2021 central budget, for example, provided RMB 89 billion for renewable-power tariff subsidies covering solar, wind and other renewable generation. These figures are not additive—definitions and periods overlap—but they demonstrate that the financial backing was measured in hundreds of billions of dollars and was reinforced by non-budgetary instruments.
The connection between this policy system and the three CS2.0 segments is revealing. In the established-dominance segment, policy succeeded in combining scale, vertical integration, domestic demand and cost reduction, producing very high export shares in batteries, solar and power equipment. In the rapid-catch-up segment, the same industrial ecosystem is now transmitting upstream advantages in batteries, electronics and automation into EVs and robots. In the strategic-frontier segment, however, the outcome remains incomplete: China has enormous scale in semiconductors but still faces technological chokepoints in leading-edge production and semiconductor manufacturing equipment. MIC2025 therefore helps explain both the realised China Shock 2.0 and the geography of the next potential shock: the strongest results appear where policy could mobilise scale and supply-chain integration, while the remaining frontier is concentrated in technologies protected by accumulated intellectual property, specialised know-how and export controls.
8. Overall assessment
China Shock 2.0 is best understood as a structural shift in the composition and technological sophistication of Chinese exports rather than as a single automotive or clean-tech event. Between 2020 and 2024, Chinese exports in the nine-group basket rose from about USD 186.6 billion to USD 347.9 billion. Yet the aggregate masks sharply different dynamics. The realised shock is strongest in batteries, EVs and a cluster of renewable-energy and power-equipment industries; robots show a fast catch-up trajectory; semiconductors and semiconductor equipment remain the strategic frontier. The segmentation therefore distinguishes where Chinese dominance is already established, where displacement of incumbents is occurring now, and where it may emerge next.
The policy evidence also cautions against interpreting these outcomes as the result of price competitiveness alone. MIC2025 and related programmes created a dense system of finance, demand support, technology policy, infrastructure, procurement and localisation incentives. That system helped firms achieve scale, deepen domestic supply chains and absorb the fixed costs of technological upgrading. The resulting export surge is therefore not simply a cyclical response to weak domestic demand: it is the international manifestation of a decade-long industrial upgrading strategy whose effects are now visible across several of the world’s most strategically important manufacturing markets.
9. Implications for Europe
Taken together, sectoral analysis reveals that the aggregate increase in China’s CS2.0 market share from 17.4 per cent in 2020 to 21.4 per cent in 2024 conceals fundamentally different competitive dynamics. The first is established or widening dominance, most clearly visible in batteries, solar PV, converters and increasingly heat pumps, where China already held a very strong position and its major competitors generally lost market share. The second is rapid competitive displacement, most clearly represented by EVs and wind equipment, where China moved from a secondary position toward or into global leadership within only four years. The third is technological catch-up, represented by industrial robots and semiconductor manufacturing equipment, where China’s market shares are rising rapidly but Japanese, American and, in robotics, German incumbents still retain important advantages. The semiconductor sector sits somewhat between these categories: China is already a major gross exporter of semiconductors, but its much weaker position in the equipment required to manufacture them indicates that export scale and technological control of the value chain are not equivalent.
From a European perspective, this comparison is particularly revealing. The competitive challenge is much less uniform than the aggregate concept of China Shock 2.0 might suggest. In solar PV and batteries, the European economies in the comparison were already far behind China by 2020, so much of the observed post-2020 development represents the further widening of an existing industrial gap rather than a new displacement shock. The most striking genuinely new challenge to Europe is concentrated in sectors in which Germany still possessed a strong position at the beginning of the period. China overtook Germany in wind equipment between 2020 and 2024, is approaching it extraordinarily rapidly in electric vehicles, and has nearly caught it in industrial robots. Conversely, China remains far behind the technological frontier in semiconductor manufacturing equipment. The data therefore suggest that the economically relevant question for Europe is not whether China is becoming dominant across manufacturing as a whole, but which remaining areas of European comparative advantage are now moving from the “catch-up” phase toward the type of Chinese dominance already observed in batteries, solar PV and other clean-technology products.
Seen from this perspective, China Shock 2.0 is considerably less overwhelming in the aggregate than the rhetoric surrounding it often suggests. It is not a general Chinese takeover of world manufacturing, but a highly concentrated shock affecting a relatively narrow set of industries in which Europe was either never strongly competitive—most obviously solar PV and batteries—or had already allowed important technological and supply-chain capabilities to migrate elsewhere. The genuinely disruptive new element for Europe is concentrated above all in one part of its traditional industrial core: the transition from conventional cars to electric vehicles. Yet even here the shock cannot be understood simply as an externally imposed Chinese assault on an otherwise healthy European industry. European carmakers entered the transition from a position of extraordinary profitability, but deliberately delayed the move towards mass-market electric vehicles, prioritising margins, premium models and conventional technologies while underinvesting in batteries, software, EV platforms and the associated supply chains. At the same time, EU climate regulation created a predictable and rapidly expanding market for electrification. Chinese policymakers and manufacturers recognised this technological and regulatory opening earlier, directed investment and industrial policy towards batteries, electric vehicles and their entire production ecosystem, achieved scale economies and ultimately filled a market niche that European regulation had helped create but European producers themselves failed to occupy. China Shock 2.0 should therefore be interpreted not simply as the consequence of China doing too much, but also as the consequence of Europe doing too little. In its most economically important European manifestation, it is as much a story of delayed investment, strategic miscalculation and a failed industrial transition in Europe as it is a story of Chinese subsidies, excess capacity or export expansion.
References and data sources
CEPII. (2026). BACI: International trade database (HS2017, Version 202601). https://www.cepii.fr/DATA_DOWNLOAD/baci/doc/baci_webpage.html
Damijan J., Damijan S. & Kostevc Č. (2026). China’s Export-Market-Share Growth and China Shock 2.0: A Unified Dynamic Panel Test of Six Competing Explanations. Mimeo, University of Ljubljana, August 2026.
Gaulier, G., & Zignago, S. (2010). BACI: International trade database at the product-level: The 1994–2007 version (CEPII Working Paper No. 2010-23). CEPII. https://www.cepii.fr/PDF_PUB/wp/2010/wp2010-23.pdf
OECD (2025). How governments back the largest manufacturing firms: Insights from the OECD MAGIC database (OECD Trade Policy Papers No. 289). OECD Publishing. https://doi.org/10.1787/d93ed7db-en
OECD (2025). The market implications of industrial subsidies (OECD Trade Policy Papers No. 296). OECD Publishing. https://doi.org/10.1787/e40b793f-en
OECD (2026). OECD MAGIC database of industrial subsidies. OECD Publishing. https://doi.org/10.1787/ce94f33b-en
OECD (2026). Subsidies and the solar panel industry: Too close to the sun (OECD Policy Briefs No. 47). OECD Publishing. https://www.oecd.org/en/publications/subsidies-and-the-solar-panel-industry_68481900-en.html
Center for Strategic and International Studies. (2023). Beyond decoupling: Managing the U.S.-China innovation relationship. https://www.csis.org/blogs/perspectives-innovation/beyond-decoupling-managing-us-china-innovation-relationship
Center for Strategic and International Studies. (2024). The Chinese EV dilemma: Subsidized yet striking. https://www.csis.org/blogs/trustee-china-hand/chinese-ev-dilemma-subsidized-yet-striking
Shivakumar, S., Wessner, C., & Howell, T. (2026, March 24). China’s localization drive in semiconductors gains impetus from allied chip export controls. Center for Strategic and International Studies. https://www.csis.org/analysis/chinas-localization-drive-semiconductors-gains-impetus-allied-chip-export-controls
 DAMIJAN blog
Koristen članek, ki pa se iz ideoloških razlogov izogne jedra problema. To lepo ilustrira naslednji pasus:
“European carmakers entered the transition from a position of extraordinary profitability, but deliberately delayed the move towards mass-market electric vehicles, prioritising margins, premium models and conventional technologies while underinvesting in batteries, software, EV platforms and the associated supply chains.”
Avtor ne razume (nima pojma!), da nobene evropsko avtomobilsko podjetje ni dovolj razvito ali veliko, da bi samo ali v kombinaciji s konkurenti vlagalo v celotno vertikalno verigo. Vložki, riziki (poslovni in regulatorni) in časovni razpon so enostavno preveliki tudi za največja evropska podjetja. Ne pozabimo, da so to tržni subjekti in večinoma borzne družbe.
Kitajska je ustvarjala podlago za svoj izvozni preboj desetletja. Zgodbo redkih zemelj poznamo, manj znano je dejstvo, da je Kitajska zavestno ekološko uničila celo regijo, da je razvila energetsko tehnološko in okoljsko zelo zahtevno industrijo. Zamislite si to v Evropi? Npr v primeru litija: Avstrijci majo velike zaloge pri Wolfsburgu na Koroškem (nekdanje mesto grofov Celjskih). Zamislite si sedaj odprti kop v turistični Koroški. Lokalni mayer-ji bi vas izstrelili iz dežele. Celo bistveno manj bogati Srbi so se kljub obljubljenemu 12 milijardnemu projektu, uprli izkoriščanju litija v dolini Jadar. S tem da so Srbi imeli (imajo?) vrhunsko znanost na področju baterij. Se da drugače? Da, ampak stane! Tam kjer gre za širše družbene sinergije, tam je vloga države.
Da ne omenim energetike. S premišljenim razvojem imajo kitajski proizvajalci bistveno prednost neposredno preko stroškov energije in posredno preko cene surovin. Danes imajo proizvajalci EV na Kitajskem v štartu tretjinsko prednost pri najdražjem delu EV tj. pri baterijah. Pa do stroška jekla, aluminija,…nismo niti prišli. S kretenskim Energiewende smo v Evropi ne samo povečali ceno energije, uničili smo cel kup še čisto dobrih delujočih kapacitet (od praktično novih TE na premog do JE). Da je kupa polna, smo uničili še evropski energetski “lifeline” preko Rusije. Se čudite, da je Evropa v zadnjih letih izgubila približno 15% svoje energetsko intenzivne industrije. S tem, da se bruseljski kreteni (ali saboterji) niso zavedli, da prav ta industrija (od umetnih gnojil do primarne kovinske in kemične industrije,….predstavlja strateško osnovo vsake (velike) ekonomije. Kje so šele baterije. Evropejci smo imeli vrhunsko znanost tako na področju katodne kot anodne strani, vendar nismo zmogli organizirati resne proizvodnje. Zakaj ne? Zato ker zahteva ogromne dolgoletne vložke, ki jih evropska privatna industrija objektivno ne zmore. Zakaj je uspelo Musk-u? Ker deluje na kapitalskem trgu, ki mu je podlaga svetovna valuta in zato ker v Ameriki – kar je javnosti manj znano- obstaja poleg vidne roke trga tudi nevidna roka vladujoče finančne oligarhije, ki preko države ali preko kontrole investicijskih skladov usmerja ekonomijo. Res mislite, da je trenutni AI balon rezultat nevidne roke trga? Če to mislite, nimate pojma, kako svetovne ekonomija v resnici deluje!
Pa najmanj omenjana prednost: izobraževalni sistem. Kitajska proizvaja milijone inženirjev s kvalitetno podlago v matematiki in naravoslovnih znanostih, med tem ko na Zahodu izobražujemo horde nezaposljivih družboslovcev, katerih študij je namenjen predvsem navideznemu zmanjšanju brezposelnosti in preživetju hipertrofirane akademske superstrukture, ki je v manjši (Evropa) oz. večji (Amerika) meri poslovno naravnana in v manjši meri deluje kot družbeni servis. Kako bomo z “gender studies” konkurirali kitajskim inženirjem na svetovnih trgih, naj si odgovorijo bralci sami?
Kako to izgleda na trgu? Pred kratkim smo dobili povpraševanje za relativno velik masiven kos za tovornjake. Kitajski konkurent je prišel s ceno s katero mi v Evropi niti cene materiala ne pokrijemo!!! Je šlo za dumping? Ne nujno, njegovi stroški od materiala, energije, infrastrukture so bistveno manjši od naših. Da izvoznih spodbud, subvencioniranja obrestnih mer in ročnosti kreditov ob bistveno razrahljanih kreditnih pogojih, niti ne omenjamo. Hvala bogu obstajajo še izdelki z veliko dodane vrednosti in zahtevno tehnologijo, na katerih gradimo svojo bodočnost. Ampak tudi Kitajci napredujejo zelo hitro.
Upadanje evropske konkurenčnosti je bistveno manj kot rezultat poslovne politike podjetij, rezultat 2 faktorjev:
Posamezna podjetja, ki delujejo v Evropi imajo objektivno določene pogoje v katerih delujejo. Razen, če grejo ven. Ampak kdo bo potem državljanom EU zagotavljal plače in vzdrževal državno birokratsko strukturo oz. socialno nadgradnjo, ko industrije ne bo več? Bomo vsi influencerji, kar si kot ideal predstavlja nemajhen del naše mladine?
Dvigne mi pritisk, ko berem levite politikov ali akademikov brez realnih izkušenj nam, ki vsak dan na svetovnih trgih bijemo bitko za preživetje. Mi nimamo časa za filozofiranje.
Prihaja čas, ko bo treba predvsem zamenjati celotno politično superstrukturo, tako doma in predvsem v EU, če hočemo ne samo obraniti življenski standard, temveč preživeti.
Všeč mi jeVšeč mi je
Avtor članka sem jaz. In “avtor” se absolutno zaveda tega, kar si napisal. Zato je v enem članku naprej, ki bo objavljen jutri v Dnevniku, uporabljena dikcija “strateške votlosti in implementacijske nesposobnosti” Evrope. In to zavedanje je seveda zajeto v ostalih člankih, ki jih objavljam vsa ta leta na to temo.
Je pa ta konkretni tekst namerno napisan v pol-akademskem jeziku, ker je pač namenjen drugi ciljni publiki. Še bolj pa empirična raziskava na to temo, ki smo jo končali ta teden in bo objavljena v akademski reviji.
Všeč mi jeVšeč mi je